Nvidia (NVDA) shares experienced a decline in early trading on Tuesday, following a substantial one-day percentage gain recorded on Monday. This surge was driven by the announcement that the AI favorite Nvidia plans to invest up to $100 billion in OpenAI. As part of this pivotal deal, Nvidia will provide OpenAI with its next-generation Vera Rubin platform, which is expected to be instrumental in constructing data centers and enhancing other AI infrastructure with a capacity of at least 10 gigawatts of power. Both companies have expressed their intentions to finalize the partnership details in the coming weeks.
In recent trading, Nvidia shares saw a decrease of 2%, settling around $180, after a remarkable nearly 4% increase on Monday. As of the close yesterday, Nvidia’s stock had surged by 37% in 2025, significantly outpacing broader market returns during the same period. Investors have shown a strong interest in the stock as large tech hyperscalers and sovereign customers continue to invest heavily in Nvidia's innovative products to enhance their AI capabilities.
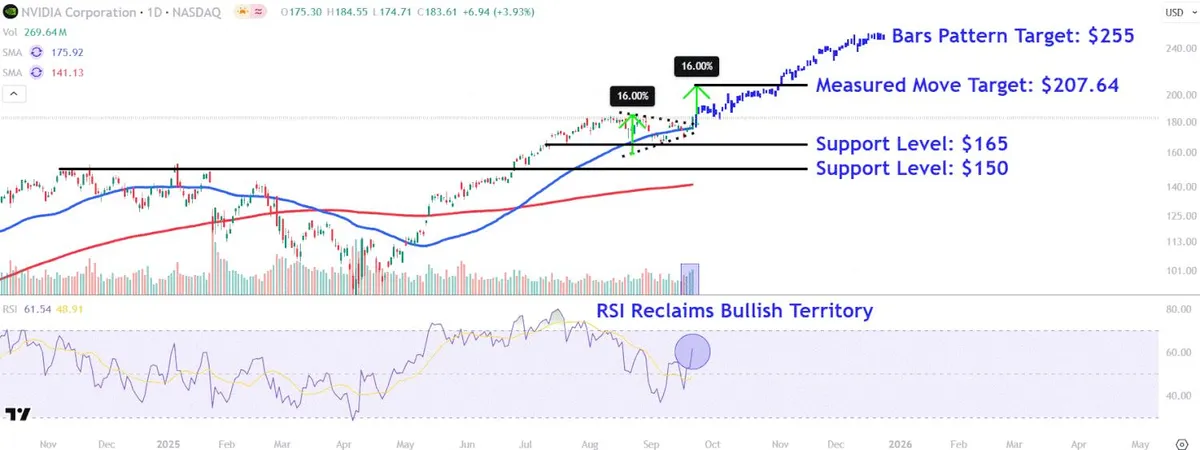
In this section, we delve deeper into Nvidia’s chart, applying technical analysis to pinpoint key price levels that investors should monitor. Following a record high achieved last month, Nvidia shares entered a consolidation phase within a symmetrical triangle. However, they broke out from this pattern during Monday’s trading session, signaling a continuation of the stock’s upward trajectory. Notably, the increase in trading volume in recent days highlights growing conviction among larger market participants.
Furthermore, the relative strength index (RSI) has returned to bullish territory, indicating strengthening price momentum. Given these indicators, it is essential to identify two potential bullish price targets on Nvidia's chart, alongside key support levels to watch for during future price corrections.
Investors can leverage the measured move technique, also known as the measuring principle, to predict an initial price target should the stock reach a new all-time high. This technique involves calculating the percentage change between the symmetrical triangle’s two trendlines at their widest section and adding it to the top trendline value. For Nvidia, applying a 16% increase to the recent closing price of $179 projects a target of approximately $207.64, which is about 13% higher than Monday’s closing price.
To forecast a longer-term price target, investors can utilize bars pattern analysis, a method that examines previous trends to anticipate future directional movements. By applying this technique to Nvidia’s chart, taking the stock's upward trend from May to August and overlaying it from Monday’s breakout point, a potential price target of around $255 emerges. This projection implies nearly 40% upside from yesterday’s close. Notably, this prior rally gained momentum after breaking above the 200-day moving average (MA), providing insights into how a new upward trend may evolve following Monday’s decisive breakout above the 50-day MA.
As we look ahead, investors should initially keep an eye on the $165 level during potential pullbacks. This level could serve as a support area, aligning with a trendline that connects a series of price movements dating back to early July. Additionally, should a more significant market drawdown occur, the stock may revisit lower support around the $150 mark. Investors might find attractive buy-and-hold opportunities in this region, as it correlates with multiple peaks that formed on Nvidia’s chart between last November and January this year.
It’s important to note that the comments, opinions, and analyses shared here are for informational purposes only. For more information, please refer to our warranty and liability disclaimer.