Advanced Micro Devices (AMD) shares experienced a significant increase on Tuesday, following a remarkable rise on Monday that brought the stock to a 19-month high. This surge is largely attributed to the announcement of a multi-year supply agreement between AMD and OpenAI, the maker of ChatGPT. Under this agreement, OpenAI is set to purchase multiple generations of AI chips from AMD, a strategic move that may lead OpenAI to acquire a 10% stake in this formidable rival to Nvidia (NVDA).
AMD has projected that this lucrative partnership could generate over $100 billion in new revenue over the next four years, not only from OpenAI but also from other clients. Following a stunning 24% jump in share price on Monday, AMD shares climbed an additional 5% to around $215 in recent trading, positioning the stock for a potential record closing high. Notably, AMD's stock has appreciated by 77% since the start of the year, significantly outperforming Nvidia’s 40% return during the same timeframe.
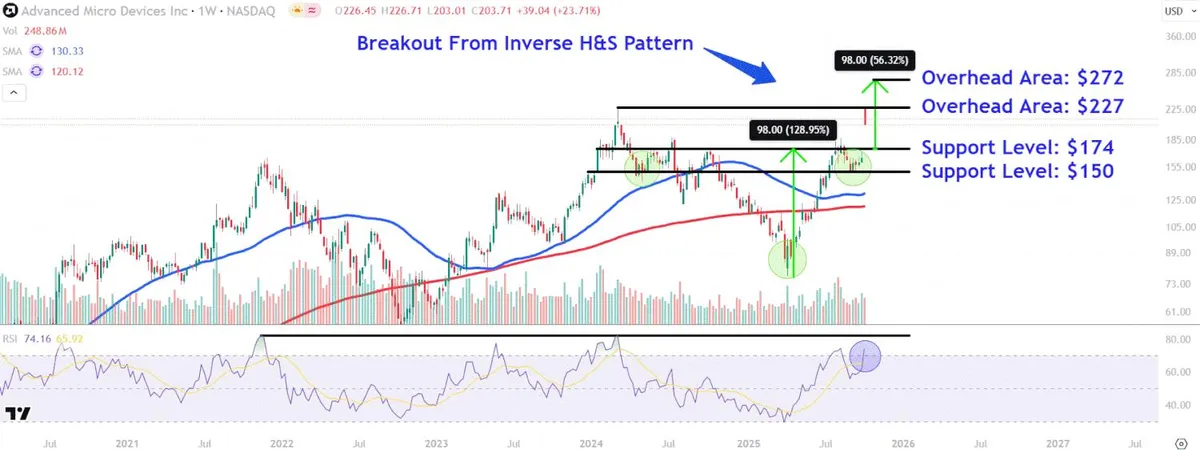
To better understand AMD's recent performance, we will analyze its weekly chart and identify critical price levels that investors should monitor. On Monday, AMD shares executed a dramatic breakout from an inverse head and shoulders pattern, setting the stage for further buying momentum. While this surge coincided with the relative strength index moving into overbought territory, it remains below the peaks seen before significant drawdowns in November 2021 and March 2024. However, the stock did close near its low for the day, signaling a potential short-term over-extension.
If AMD's shares manage to regain their upward momentum, investors should closely watch the $227 area. This price point is likely to attract considerable attention, as it aligns with Monday's high and lies just below the stock's all-time intraday high set in March of last year. To project potential future price movements, investors can employ the measuring principle. By analyzing the distance from the head of the inverse head and shoulders pattern to the neckline, we can forecast future price targets. For instance, by adding $98 to the neckline of $174, we arrive at a bullish target of $272, which is approximately 34% above Monday's closing price.
As investors monitor AMD's stock for potential retracements, they should particularly focus on the possibility of filling the gap down to around $174. This price range is likely to be viewed as a high-probability buying area, coinciding with the neckline of the inverse head and shoulders pattern, which may transition from previous resistance to future support. Additionally, a more significant pullback could lead to a retest of the $150 level. This area on the chart may provide support near the two shoulders of the inverse head and shoulders pattern, closely aligning with the December 2023 high.
For investors considering AMD's stock, these price levels and technical indicators are crucial for making informed decisions. Remember to conduct thorough research and consult with financial experts to navigate the complexities of stock investments effectively.
The insights and analyses provided here are for informational purposes only. For more information, please refer to our warranty and liability disclaimer.