Nvidia (NVDA) shares experienced a significant decline of nearly 7% on Wednesday after the company announced it would incur a substantial charge of $5.5 billion due to new U.S. restrictions on the export of its AI chips to China. This announcement, made through a regulatory filing, revealed that Nvidia would be required to obtain an export license to sell its popular H20 chips to China. The U.S. government is concerned that these chips could be utilized by Beijing to develop advanced supercomputers.
This unexpected development has caught many market watchers by surprise, especially since Nvidia originally designed the H20 graphics processing units (GPUs) to comply with Biden-era chip export curbs. These curbs were aimed at preventing foreign adversaries from accessing advanced technology that could pose a national security risk. As of Wednesday's close, Nvidia shares have seen a modest recovery from the lows experienced earlier this month, yet they have still lost approximately one-fifth of their value since the beginning of the year, largely due to uncertainty surrounding Washington's trade policies and the spending trends of major tech companies in the AI sector.
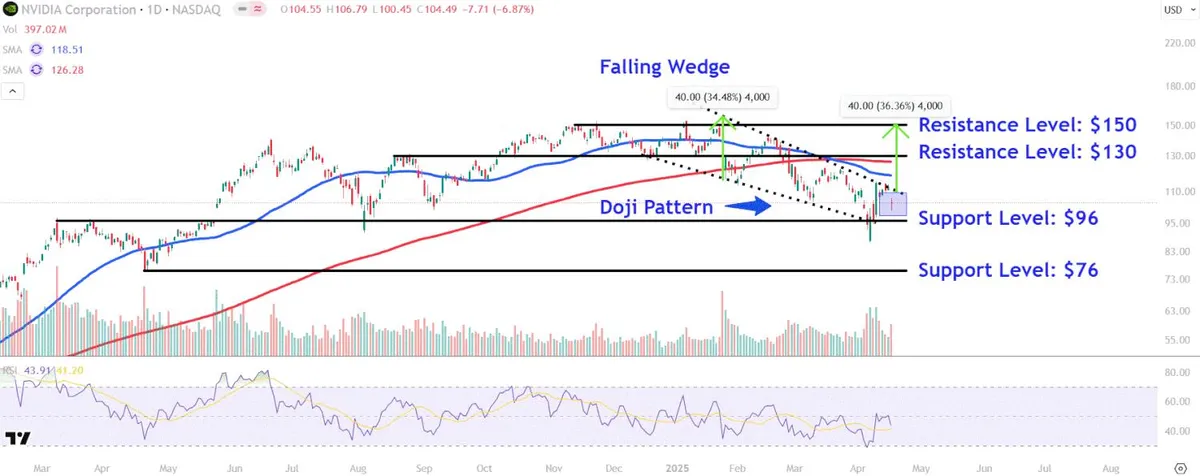
In light of the recent developments, let's take a closer look at Nvidia's stock chart and apply technical analysis to identify key price levels that investors should monitor. A notable Doji candlestick pattern has emerged, indicating a period of indecision in the market. After attracting buying interest near the lower trendline of a falling wedge pattern last week, Nvidia shares rallied sharply. However, they soon encountered selling pressure near the pattern’s upper trendline.
On Wednesday, Nvidia shares closed at $104.49 after a 6.9% drop. If selling pressure continues, the stock may initially revisit support around the $96 mark. This level is significant as it coincides with last year’s prominent March twin peaks, which could attract buyers. Additionally, this area is situated just above the current month’s low driven by tariffs. Should the bulls fail to defend the April low, a more considerable decline to the $76 level could occur. Investors may look for strategic buy-and-hold opportunities in this vicinity, particularly near last April’s notable swing low.
Conversely, a volume-backed breakout above the falling wedge pattern’s top trendline could propel Nvidia shares to around $130, which is just above the 200-day moving average. This price area may present overhead resistance, particularly near the peaks from August and troughs from December. If the stock manages to break above this resistance, it could potentially climb to $150, a price point where many investors might consider locking in profits. This level aligns with several peaks that formed on the chart just below the stock’s record high set earlier this year in January.
Additionally, a projected measured move price target suggests that adding $40 to the falling wedge pattern's depth of $110 forecasts an upside target of $150.
In conclusion, the recent export restrictions on Nvidia's AI chips could have far-reaching effects on the company's stock performance. Investors should keep a close eye on the identified support and resistance levels as they navigate the complexities of the market amid ongoing trade policy uncertainties.